With the
recent announcement of all four rosters for the 2017 MacRobertson Shield to be held in Rancho Mirage, California, in April and early May, we can now take a snapshot look at how the rosters stack up from a statistical perspective. I am going to present this in three separate postings starting with today's look at individual stats. The future postings will include a Trendline Player Rank look and a Cumulative Team Stats Analysis.
For the tables below, I'll offer some comments on items that caught my eye, but it's primarily from a statistical look as I rarely get to watch even the US players and have no in-person experience watching players from the other three teams. I would encourage anyone with more insight to fill up the comments section with feedback.
Again, this is a snapshot of data pulled on January 25, 2017, that comes from the incredibly useful/essential
croquetrecords.com website. It includes 12 months of player stats for each team and will of course fall out of date as more events are played between now and the event.
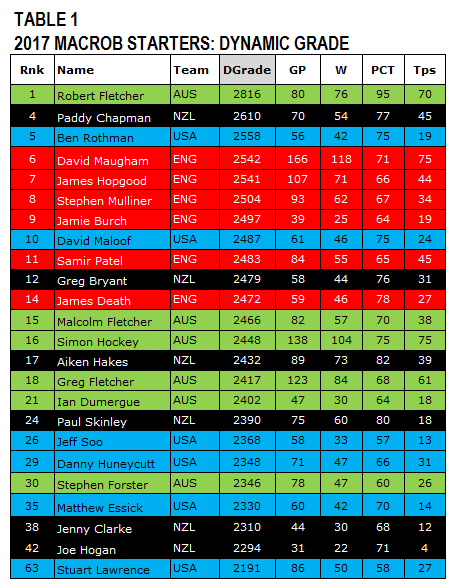
Starting with Table 1, we show a ranking of all of the MacRob players based on Dynamic Grade (DG), which would likely be considered the fairest comparison metric. The player backgrounds are color-coded by country just to enhance the visual balance of power. So, Table 1 clearly shows England with the most powerful team from the DG perspective, but the interesting note is that the other three countries have #1 players currently above England. At a glance, you would project a split for England in the 1/2 singles matches, but by the same reasoning they would of course dominate the 3/4 and 5/6 games. That alone could net 10 wins, with only 11 needed for a test win.
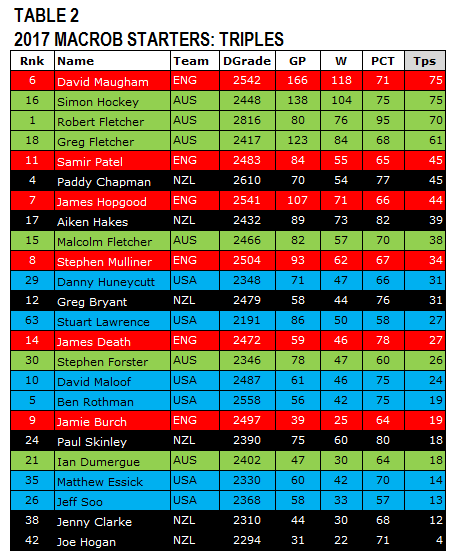
In Table 2, we look at the number of Triples over the past 12 months. It's relative of course to competition, but still paints a picture on competence level in the current window along with activity. England's David Maugham is the leader on this one, but Australia looks strong on this table. This could indicate a strong performance for the Australian team in all three groupings of the singles matchups.
For Table 3, we look at game win totals and again we have David Maugham at the top of the list. In fact, this list is relatively similar to the Triples ranking for the obvious reason that a triple equals a win. Australia looks to be particularly strong in the 3/4 matches based on this look. Stuart Lawrence leads the US team with wins despite having the lowest DG, which indicates that he is clearly putting in a lot of preparation for the event.
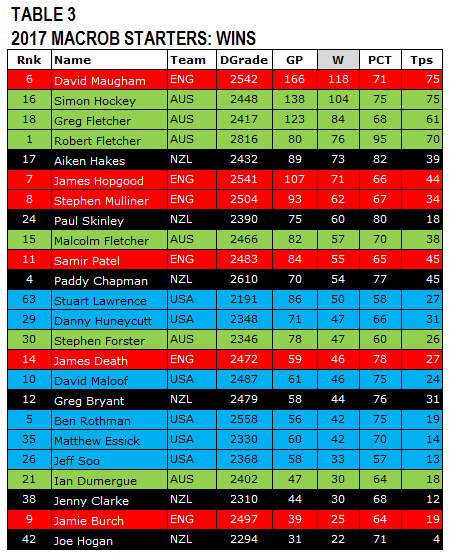
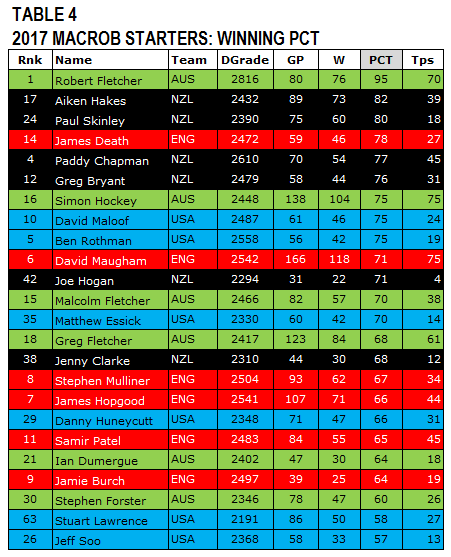
Table 4 looks at winning percentage and New Zealand has the clear advantage in this view. Of note, the 3/4 DG players Aiken Hakes and Paul Skinley actually rank ahead of the 1/2 players for the team. Since players are most likely to have the majority of their games in country, the level of competition is a factor to consider. Of course in this particular 12 month span, we do have the 2016 WCF World Championship. In addition, Paddy Chapman, Ben Rothman and Matthew Essick also participated in the British Opens -- considered the most challenging competition in Association Croquet outside of the World Championship.
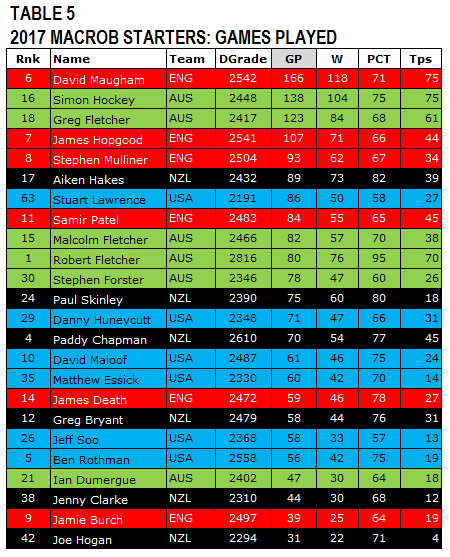
Table 5 is a simple look at total games played over the 12-month window and again we see England's David Maugham at the top of the list with a 166 games. That's quite a regimen for a year. England looks strong here overall as does Australia. Primarily, I'd say this table is about who is putting in the most games to prep for the event.
I should note that I have mentioned the 1/2, 3/4 and 5/6 player spots. The teams are not obligated to use rankings to set their line-ups, so the line-ups can actually vary from the one through six projection that would be anticipated by looking at the DG ranking list. Actual line-ups are generally submitted very near the start of each individual test.
As mentioned above this is the first of three posts and next week we'll take a look at a Individual Trendline pair of charts.